Surgical Technologist Salary in Torrance, CA: $86,549 (2026)
Quick Answer:A full-time surgical technologist in Torrance, CA earns a median $86,549/year (≈ $41.61/hour) in nominal terms for 2026 — projected from BLS OEWS 2025 (SOC 29-2055). Once you factor in Torrance's price level (13% above national, BEA RPP 113.1), that paycheck buys what $76,524 would nationally. Nominal pay sits 1.7% above the California state average.
Based on BLS state-level estimates · View source
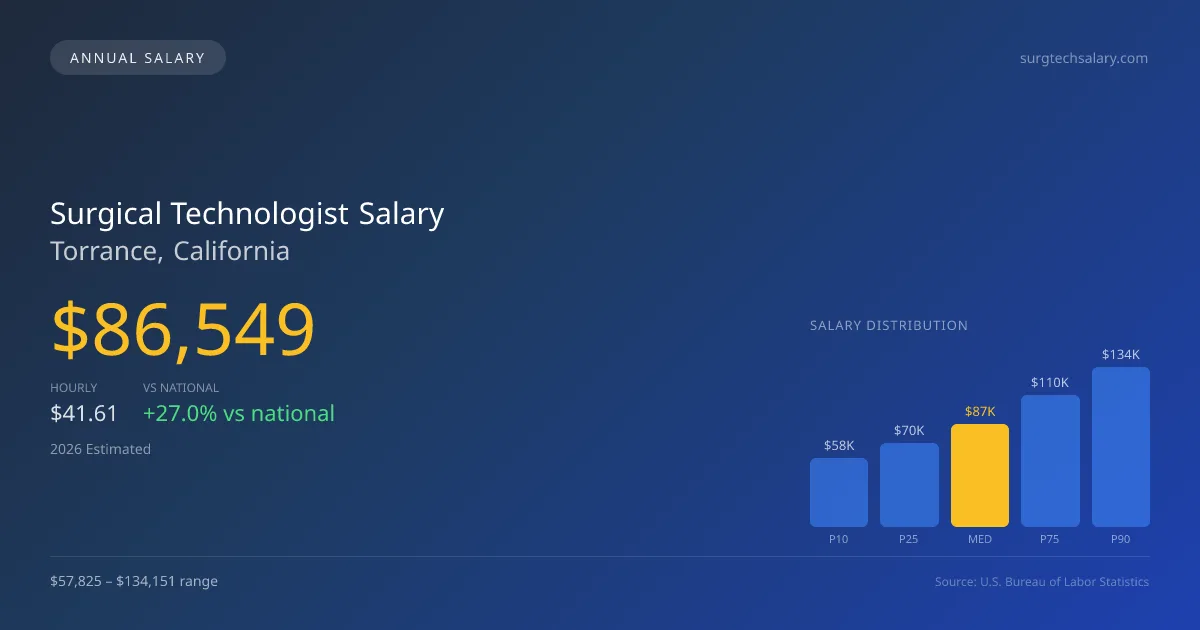
Surgical technologists in Torrance, California, can anticipate an attractive median annual salary of $86,549 in 2026, reflecting a competitive advantage over the national median of $68,141. This promising figure is part of a salary range that spans from $57,825 at the 10th percentile to an impressive $134,151 at the 90th percentile, based on estimates derived from 2025 BLS data and regional cost adjustments. The opportunity for specialized roles, especially within cardiovascular and neuro surgeries, significantly increases earning potential. With the rising demand for skilled surgical technologists and advancements in minimally invasive procedures, the job market in Torrance suggests a strong outlook for professionals looking to secure higher wages through specialization.
About the Torrance Market
Salary estimated from California average ($78,000) adjusted for local cost of living.
Salary Breakdown
| Percentile | Annual | Hourly |
|---|---|---|
| Entry Level (P10) | $57,825 | $27.80 |
| Lower Range (P25) | $70,244 | $33.77 |
| Median (P50)(typical) | $86,549 | $41.61 |
| Upper Range (P75) | $110,357 | $53.06 |
| Top Earners (P90) | $134,151 | $64.49 |
Median Salary Position
27.01% above the national average
2026 Salary Percentile Distribution in Torrance
In Torrance, CA, the surgical technologist salary spread from the 10th to 90th percentile is $76,326 (2026 est.). At $86,549, the local median is 27.01% above the national median of $68,141.
Salary Calculator
At 40 hours/week in Torrance: You'd be in the lower-middle range
How Torrance Surgical Technologist Pay Compares
Torrance median: $86,549/year (2026)
| Compared To | Median Salary | Torrance Pays |
|---|---|---|
| California Average | $85,102 | +1.70% more |
| National Average | $68,141 | +27.01% more |
Surgical Technologists in Torrance, CA earn a median of $86,549 per year (2026 est.), which is 27.01% higher than the national median of $68,141 and 1.70% above the California state average of $85,102.
Cost-of-Living Adjusted Salary
Torrance has a cost of living 13.10% above the national average.
Adjusted salary = nominal × (100 / CoL index). CoL index: 100 = national average.
Torrance, CA has a cost-of-living index of 113.1 (above the national average of 100). While the nominal salary of $86,549 is competitive, the higher cost of living reduces purchasing power to an effective $76,524 — a 11.58% reduction.
Compare Purchasing Power
Select a city to see how your salary compares after cost of living
Select a city above to compare purchasing power
2019 BLS Actual
$61,348
2025 BLS Actual
$82,115
2026 Current Est.
$86,549
2019–2027 Growth
+48.7%
Salary Trajectory for Surgical Technologists in Torrance (2019–2027)
2019–2025: actual BLS OEWS data for this metro area. 2026+: CAGR 5.40% projection.
| Year | Annual Salary | Status |
|---|---|---|
| 2019 | $61,348 | Actual |
| 2020 | $63,139 | Actual |
| 2021 | $61,640 | Actual |
| 2022 | $71,077 | Actual |
| 2023 | $76,984 | Actual |
| 2024 | $89,731 | Actual |
| 2025 | $82,115 | Actual |
| 2026(current) | $86,549 | Estimated |
| 2027 | $91,223 | Projected |
Based on 7 years of BLS OEWS data for the Torrance metropolitan area, the median surgical technologist salary grew 33.9% from $61,348 (2019) to $82,115 (2025). At a 5.40% compound annual growth rate, salaries are projected to reach $91,223 by 2027 — a total increase of $29,875 (48.70%) from 2019.
Note: Historical values (2019–2025) are actual BLS OEWS figures for the Torrance metropolitan area, sourced from annual Occupational Employment and Wage Statistics surveys. 2026–2026 figures are current estimates, and 2027 values are projections, calculated using a 5.40% CAGR derived from 7-year BLS historical data. Actual salaries may vary based on employer, experience, certifications, and local market conditions.
Salary by Experience Level
| Experience | Estimated Salary Range |
|---|---|
| 0-2 years (New Graduate) | $57,825 – $70,244 |
| 3-5 years (Mid Career) | $70,244 – $86,549 |
| 5+ years (Experienced) | $86,549 – $110,357 |
| 10+ years (Top Earner) | $110,357 – $134,151 |
Surg Tech, CST salary ranges estimated from BLS percentile data. Individual surgical technologist compensation varies by employer, certifications, and specialization.
Surgical Technologist Job Market in Torrance
In Torrance, the local job market supports 26 surgical technologists, indicative of a niche yet vibrant healthcare environment. The cost of living index stands at 113.1, which means that while salaries are comparatively higher, expenses are also elevated, affecting purchasing power. Employers in hospital operating rooms typically offer the most competitive salaries, surpassing those in ambulatory surgery centers and specialty surgical centers. The disparity in wages can often be attributed to the type of surgical specialty, with cardiovascular and neurosurgery roles commanding premium compensation. To maximize income potential in this market, professionals should consider pursuing certifications in robotic surgery and advancing to roles like surgical first assistant. Additionally, positions in trauma centers or military units often provide higher pay, making these sectors worthwhile for surgical technologists seeking to enhance their earnings.
More salary data for Torrance, CA:
Frequently Asked Questions
How much do surgical technologists make in Torrance, CA in 2026?
Is Torrance, CA a good place to work as a surgical technologist?
Can surgical technologists make $100K in Torrance?
What is the cost-of-living adjusted surgical technologist salary in Torrance?
How much does a surgical technologist make per hour in Torrance?
Related Pages
Compare Salaries
Career Resources
Nearby Cities in California
Written by Jessica Thompson, BA, CST
Career Analyst
Jessica has over 10 years of experience as a surgical technologist. She specializes in orthopedic surgical procedures. Jessica works at a community hospital.
Methodology & Data Source
Salary figures on this page are 2026 projections based on the Bureau of Labor Statistics Occupational Employment and Wage Statistics (OEWS) survey, May 2026 release. The BLS reported a median annual salary of $82,115 for surgical technologistsin the Torrance metropolitan area. A 5.40% compound annual growth rate (CAGR), calculated from 6-year national BLS wage trends, was applied to project current 2026 compensation. Percentile ranges (P10–P90) represent the full salary distribution across experience levels and practice settings in this market.
Data Sources & Methodology
Salary data for Torrance is estimated from official BLS state-level occupational wage data (2025), adjusted for regional cost-of-living differences using BEA RPP (Regional Price Parities).
2026 figures are projected from 2025 BLS data using a compound annual growth rate (CAGR) of 5.40%, derived from historical BLS wage trends for surgical technologists (SOC 29-2055).
Compiled and verified by Jessica Thompson, BA, CST, a licensed surgical technologist with 10+ years of clinical experience. · View source data at BLS.gov