Senior Surgical Technologist Salary in Woburn, MA: $113,624 (2026)
Quick Answer:The top tier of surgical technologists working in Woburn, MA — those at or above the 90th percentile — pull in $113,624/year or more for 2026, based on BLS OEWS 2025 estimates for SOC 29-2055. Strip back Woburn's price premium (BEA RPP 108.5, 9% above national) and that top-decile pay carries the same buying power as $104,723 in average-cost America. The 44% spread above city median typically rewards 7+ years of practice or specialty credentials.
Based on BLS state-level estimates · View source
In Woburn, Massachusetts, senior surgical technologists command a competitive salary, with top earners projected to reach $113,624 in 2026. This figure positions Woburn's pay significantly above the national average for experienced professionals, showcasing an experience premium that highlights both the challenges and rewards of advancing in this field. The gap between the median salary of $78,730 and the superior earning potential for those at the upper end of the salary range emphasizes the opportunities available to those who invest in their education and specialization. Achieving such top-tier pay generally requires a combination of extensive experience—typically over seven years—and advanced certifications, particularly in high-demand areas such as robotic surgery, trauma care, and various surgical specialties.
About the Woburn Market
Salary estimated from Massachusetts average ($68,000) adjusted for local cost of living.
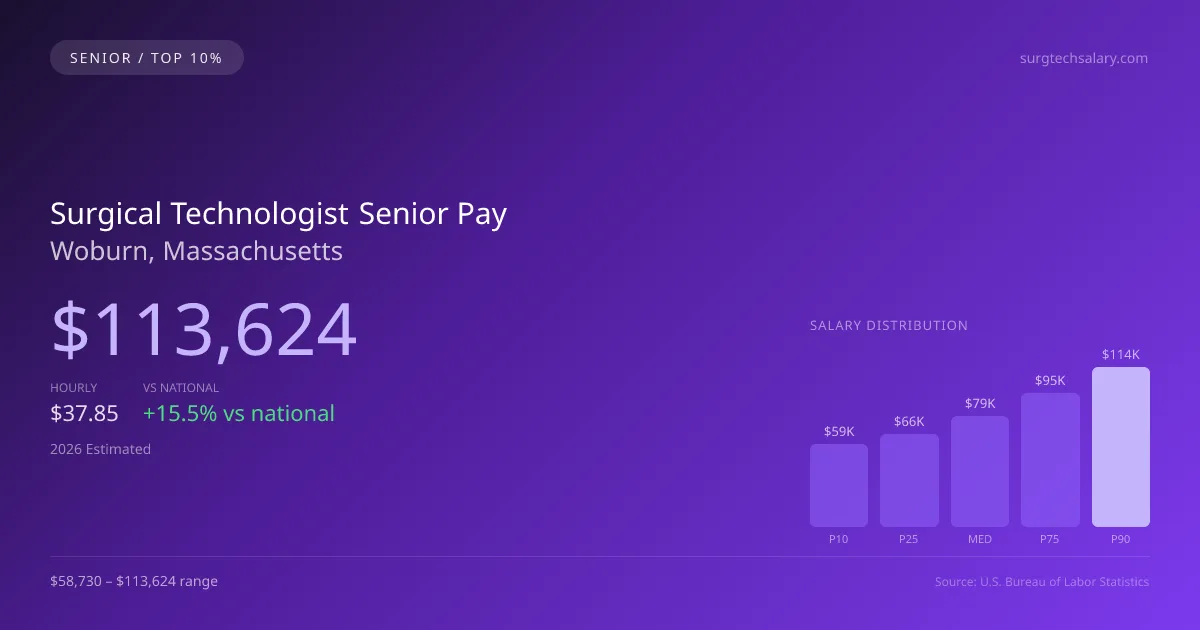
2026 Salary Percentile Distribution in Woburn
Experienced surgical technologists at the top of the pay scale in Woburn earn between $95,453 and $113,624 per year (2026 est.). This $54,894 range from 10th to 90th percentile reflects significant earnings potential growth over a career. The Woburn median of $78,730 sits 15.54% above the US median.
Top Surg Tech, CST Salary Comparison
| Level | Woburn | National |
|---|---|---|
| Median (P50) | $78,730 | $68,141 |
| 75th Percentile | $95,453 | $84,057 |
| 90th Percentile (Top 10%) | $113,624 | $102,175 |
In Woburn, experienced surgical technologists (P90) earn 44.32% more than the local median — reflecting the significant value of specialization and tenure in this market.
What Drives Top Surgical Technologist Pay in Woburn
Advanced Certifications in Massachusetts
MA surgical technologists with additional specialty certifications within the surgical services field earn significantly above the $78,730 median. Expanded-scope credentials are increasingly valued by Woburn employers.
Specialty Focus
Surgical Technologists focusing on high-acuity or specialty areas within the surgical services field in Woburn command premium compensation, often reaching the $95,453–$113,624 range.
Large Health-System & Multi-Site Experience
Large hospital systems and multi-site employers in the Woburn metro area often pay above-market rates for experienced surgical technologists who demonstrate efficiency and leadership.
Employer Loyalty & Patient Relationships
Long-tenured surgical technologists in Woburn with established relationships have strong negotiating leverage. In this developing market, retention bonuses and annual raises are common for top performers.
Continuing Education & Leadership
Surgical Technologists in Massachusetts who pursue advanced degrees, mentor junior staff, or lead clinical education programs position themselves for the highest compensation tiers and management roles.
Surgical Technologist Career & Wage Growth Path in Woburn
Clinical Surgical Technologist
0-5 yearsSenior/Lead Surgical Technologist
5-10 yearsSurgical Technologist Department Manager
10+ yearsEducator / Specialty Leadership
AdvancedWoburn ranks #52 of 58 Massachusetts cities for top earner surgical technologist salary (90th percentile: $113,624).
Top 10% surgical technologist compensation in Woburn ($113,624) is 3.75% below the Massachusetts average P90 ($118,051).
2019 BLS Actual
$79,401
2025 BLS Actual
$107,803
2026 Current Est.
$113,624
2019–2027 Growth
+50.8%
Salary Trajectory for Surgical Technologists in Woburn (2019–2027)
2019–2025: actual BLS OEWS data for this metro area. 2026+: CAGR 5.40% projection.
| Year | Annual Salary | Status |
|---|---|---|
| 2019 | $79,401 | Actual |
| 2020 | $81,303 | Actual |
| 2021 | $84,450 | Actual |
| 2022 | $87,363 | Actual |
| 2023 | $92,468 | Actual |
| 2024 | $97,502 | Actual |
| 2025 | $107,803 | Actual |
| 2026(current) | $113,624 | Estimated |
| 2027 | $119,760 | Projected |
Top-earning surgical technologists (90th percentile) in Woburn saw their compensation grow 35.8% from $79,401 in 2019 to $107,803 in 2025, based on 7 years of BLS OEWS data for this metropolitan area. At a 5.40% annual growth rate, senior-level pay is projected to reach $119,760 by 2027, reflecting continued demand for clinical expertise and expanded-function credentials.
Note: Historical values (2019–2025) are actual BLS OEWS figures for the Woburn metropolitan area, sourced from annual Occupational Employment and Wage Statistics surveys. 2026–2026 figures are current estimates, and 2027 values are projections, calculated using a 5.40% CAGR derived from 7-year BLS historical data. Actual salaries may vary based on employer, experience, certifications, and local market conditions.
Maximizing Your Surgical Technologist Earnings in Woburn
Specializations play a critical role in determining compensation levels for senior surgical technologists. In Woburn, areas like cardiovascular surgery, neurosurgery, and orthopedic surgery can result in premium pay, reflecting the complexity and skill required in these fields. Employment settings also influence salaries; for instance, positions in prestigious hospital operating rooms or specialized surgery centers may offer greater compensation compared to ambulatory care settings. Furthermore, advancing within the surgical technology career path can lead to leadership roles—such as surgical first assistant or OR supervisor—which promise not just salary boosts but also added responsibilities and prestige. Obtaining advanced credentials, like becoming a CST or obtaining CSFA certification, enhances marketability and positions professionals favorably for higher earnings. Non-salary compensation factors also play a role, as certifications in robotic surgery and call coverage stipends can significantly augment a senior surgical technologist's overall income in MA.
More salary data for Woburn, MA:
Frequently Asked Questions
How much do experienced surgical technologists make in Woburn in 2026?
What drives higher surgical technologist pay in Woburn?
What certifications boost surgical technologist salary in Woburn?
Can experienced surgical technologists make six figures in Woburn?
How much does surgical technologist salary increase over time in Woburn?
Related Pages
Compare Salaries
Career Resources
Nearby Cities in Massachusetts
Written by Jessica Thompson, BA, CST
Career Analyst
Jessica has over 10 years of experience as a surgical technologist. She specializes in orthopedic surgical procedures. Jessica works at a community hospital.
Methodology & Data Source
Top-earner salary figures on this page are 2026 projections derived from the Bureau of Labor Statistics Occupational Employment and Wage Statistics (OEWS) survey, May 2026 release. BLS reported a 90th percentile salary of $107,803 for surgical technologists in the Woburn metro area. A 5.40% compound annual growth rate (CAGR), calculated from 6-year national BLS wage trends, was applied to project current 2026 senior-level compensation. Individual earnings depend on certifications, specialization, practice type, and years of clinical experience.
Data Sources & Methodology
Salary data for Woburn is estimated from official BLS state-level occupational wage data (2025), adjusted for regional cost-of-living differences using BEA RPP (Regional Price Parities).
2026 figures are projected from 2025 BLS data using a compound annual growth rate (CAGR) of 5.40%, derived from historical BLS wage trends for surgical technologists (SOC 29-2055).
Compiled and verified by Jessica Thompson, BA, CST, a licensed surgical technologist with 10+ years of clinical experience. · View source data at BLS.gov